Light Bulbs in Series
Incandescent light bulbs are designed to output light at the rated power at the mains voltage. Light is produced by a tungsten filament which is heated to a very high temperature, about 2000°C. With the black body assumption, we have, using Wien’s displacement law, λT = constant, where λ is the wavelength in the emission that has the highest intensity. Considering that the Sun, with a temperature of about 6000°C has its peak at around 500 nm, the peak for a light bulb lies in the infra red region. This means that most of the power is radiated as heat.
If two bulbs are connected in series, and the system connected to the mains, voltage available to each is halved. The power input to the bulbs is given by Ohm’s law, V²/R. However, since the power is lower, the temperature is lower too, and hence the resistance is also lower. This means that the power output is not as small as it would be if the resistance variation with temperature was low. The net power would be reduced, but what about the brightness? It will be much lower—as the temperature drops, the black body curve shifts to the right on the intensity wavelength plot, and a very small fraction is now radiated in the visible region. Thus, a 100 W bulb connected with other bulbs such that the power consumed is 25 W will be much dimmer than a 25 W bulb at the rated voltage. The room temperature resistivity of tungsten (300K) is about . This means that the value at the operating temperature of 2300 K will be around
. (This also explains the “inrush current” when a bulb is first switched on.) The working temperature can be obtained from an iterative procedure. As a first approximation, we can assume the resistance to be unchanged, and then calculate the total power. For a black body, the total emitted power is proportional to the fourth power of temperature (Stefan’s law,
). Since the voltage has halved, the temperature has fallen by a factor of 1.414. The new temperature gives a resistivity value of around 30. The equation is easily solved using a computer (see the source code below). As can be seen, the final temperature is around 1830 K or 1600°C. The max intensity has shifted to a longer value. Even though the original value was also in the infrared region, this has much smaller amount in the visible. Once again, assuming the black body radiation formula, we have
#include
#include
int main(int argc, char** argv){
float q, prevq, prevr, r;
prevq = 2300;
prevr = 5.5 + (prevq – 300) * 0.025;
q = prevq/sqrt(2);
while (1) {
r = 5.5 + (q – 300) * 0.025;
q = q * sqrt(prevr/r);
printf(“Resistance = %5.0f\n Temperature = %5.0f\n”, r, q);
if (fabs (q – prevq) < 5 )
break;
prevq = q;
prevr = r;
}
return 0;
}
[/sourcecode]
The amount of light available from the bulb should be adjusted with the brightness curve for the human eye, which is most sensitive to yellow. Thus, the power available in the red region of the spectrum is not as useful as the one in the yellow region.
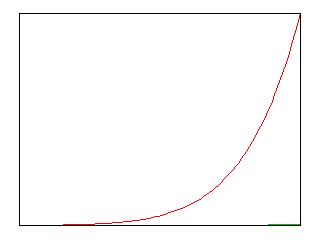
[caption id="attachment_197" align="aligncenter" width="320" caption="The total power output from bulbs at different voltages"]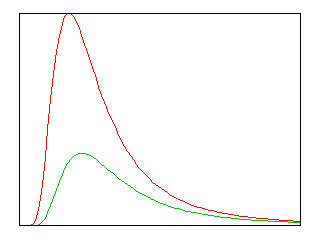 [/caption]
The above image shows that the power output (given by the area under the curve) is lower for the second case. However, one might expect that would have significant light since it is consuming 25 W of power.
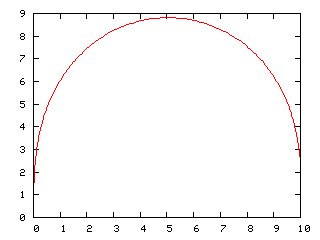
The above image shows the output in the visible region—300 to 700 nm—and we can see that the line from the other bulb is not visible at all. This means that it will not have any visible light that you can see. What you effectively have is an infra red lamp!.
The illumination of a light source is provided in terms of candle power. Once again, this is not a good measure, unlike something like mass or length which can be measured to a very high degree of accuracy. Just like loudness of a sound, the optical property of brightness is a psychological phenomenon. And just like the psycho-acoustical phenomenon will lead you believe some sounds in certain frequencies (that commonly used in human speech) to be louder than others, the brightness is also mediated by the brain, so it varies from individual to individual.

